Client
Mercator Ocean International
Field
Earth Observation
Media
Online
Category
Design & Graphic
Location
Cologne
Year
2024
Challenge
With the release of the new Copernicus Coastal and Arctic Hubs, Mercator Ocean reached out to Design & Data with the challenge of generating a “Data in Nutshell” infographic of each of these hubs.
These hubs offer open and free Earth Observations data, encompassing a wide array of variables across air, sea, and land products.
Our goal was to offer users a clear and concise overview of the available data and variables.
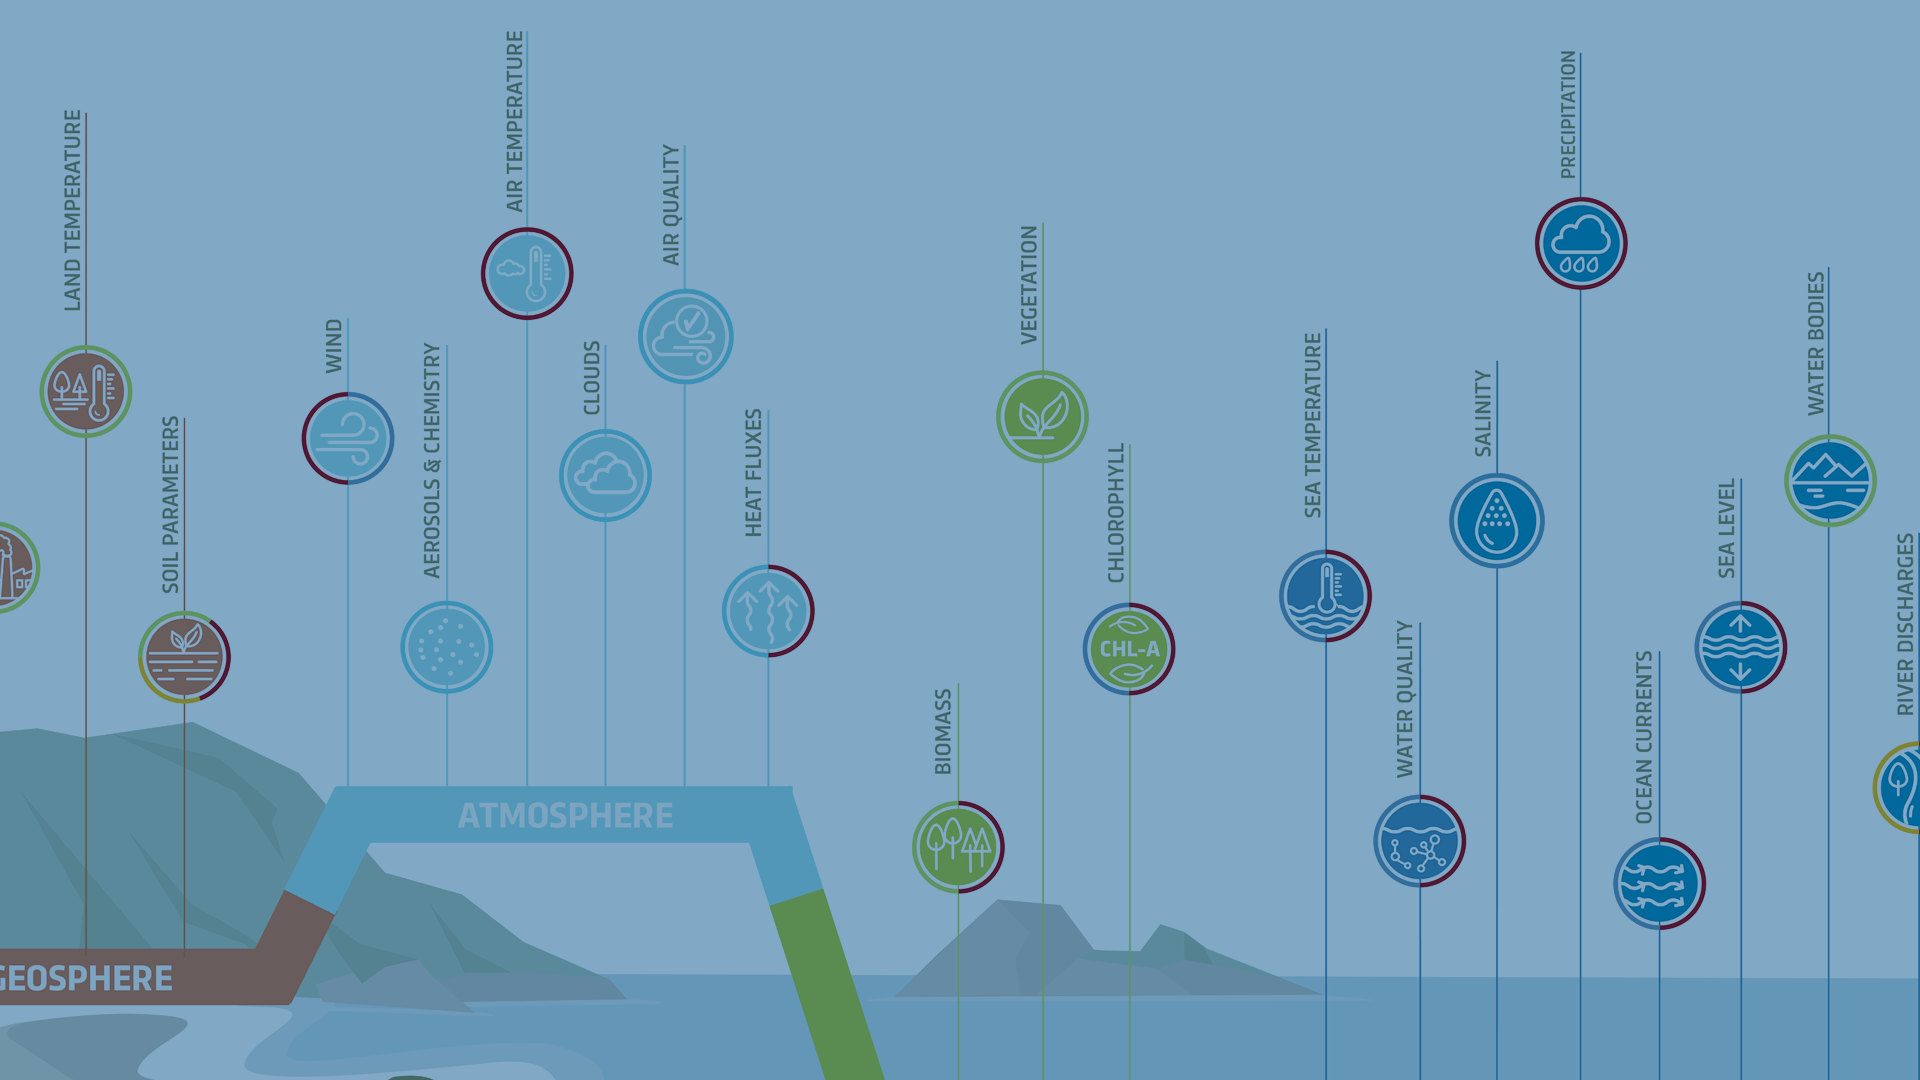
Idea, solution
The “Data in a Nutshell” infographics were meant to act as visual guides for users. Our first step was to analyze the wide range of variables and organize them into user-friendly categories. After experimenting with hand-drawn wireframes, we devised a simple but effective way to visualize these categories using icons. This approach helped us create a clear and intuitive visualization of the different variables and categories for users.
Result
Two visually engaging infographics have been created to assist users in discovering and exploring the Copernicus Coastal and Arctic hubs, offering a comprehensive overview of the Earth Observation variables available within each.
Both infographics can be found in the “Data in a Nutshell” sections of the respective hub websites.
Copernicus Coastal Hub: https://www.coastal.hub.copernicus.eu/data-in-a-nutshell
Copernicus Arctic Hub: https://www.arctic.hub.copernicus.eu/data-in-a-nutshell

