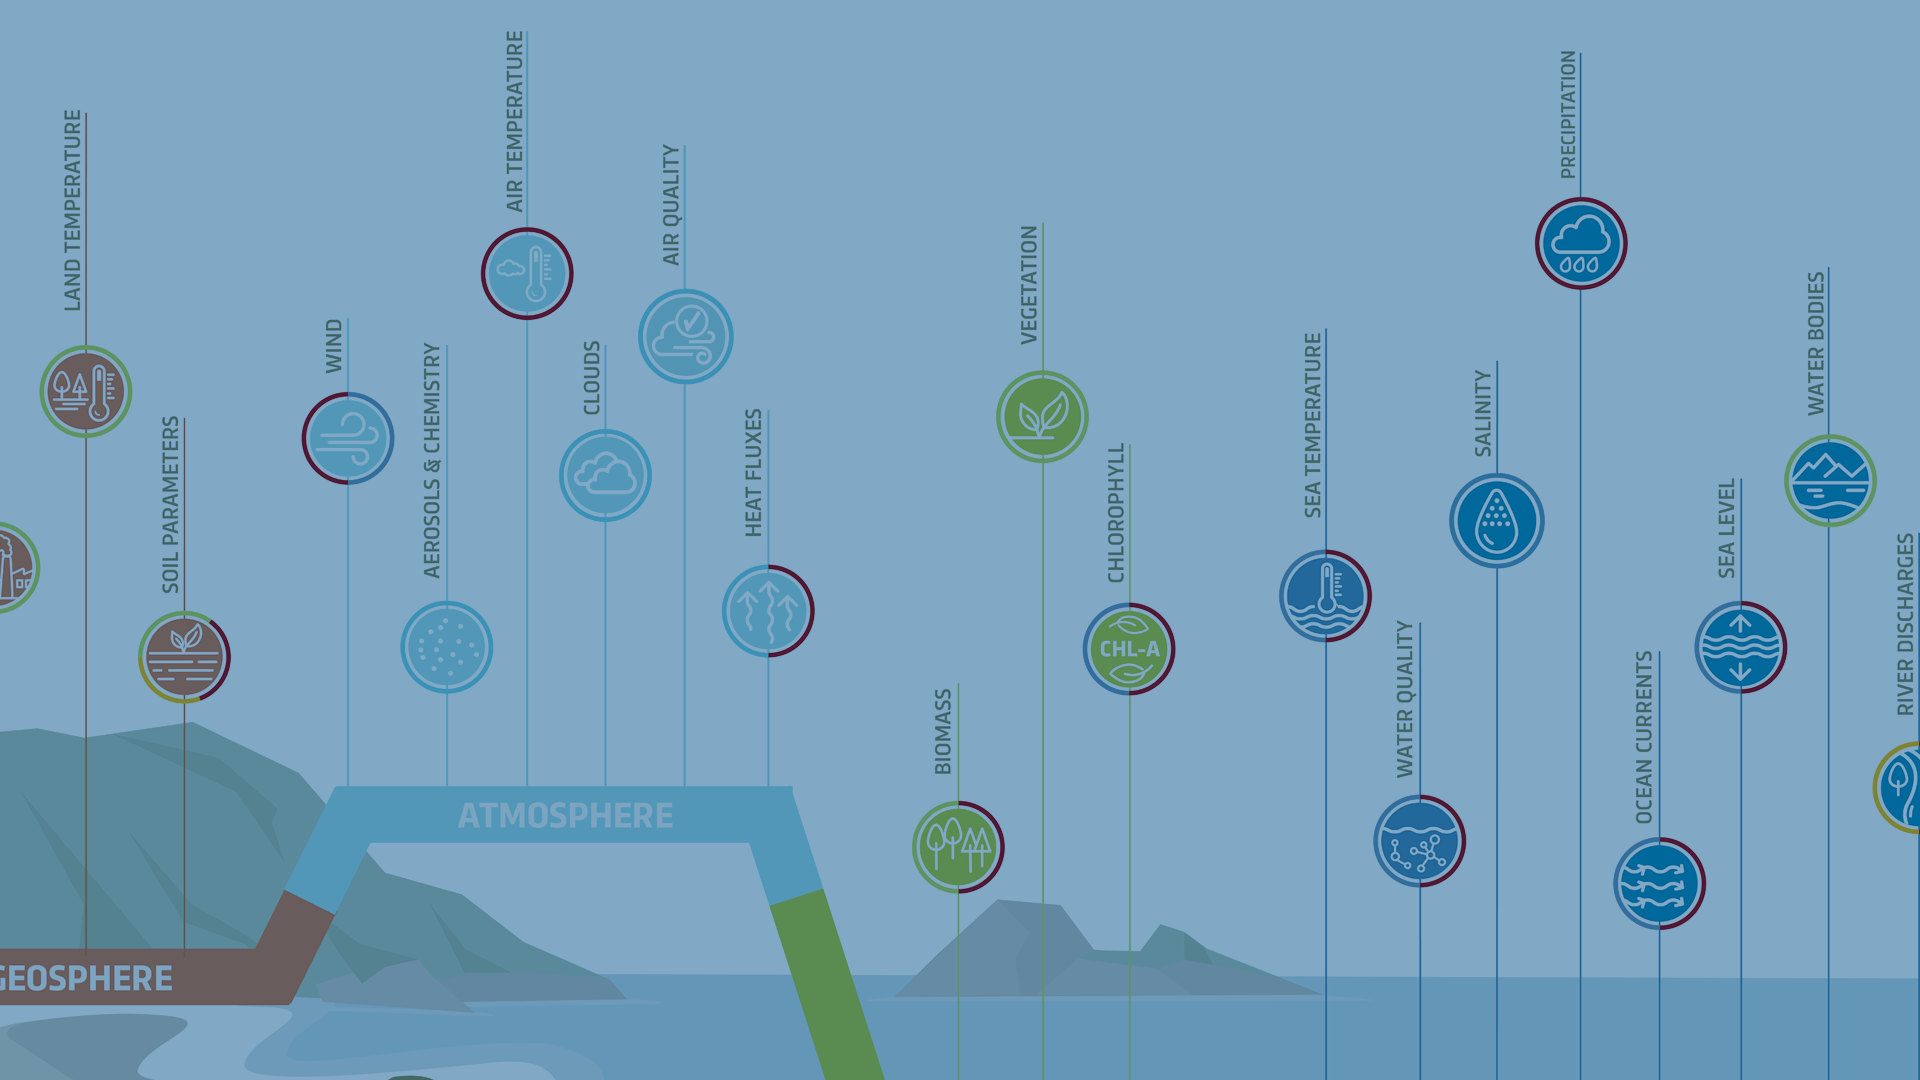
Crafting 'In a Nutshell'Infographics forEarth Observation Data
In the realm of infographics, the concept of 'data in a nutshell' implies presenting information that is clear, concise, and offers valuable insights without inundating the audience with unnecessary details. Explore our approach here.
Explore more
A new episode inMercator'sAnimation Series:Digital TwinOcean 2
Explore more
NEWCorporate Identitysame commitment
How we give a technical company a fresh and modern look & feel
Explore more

5 effective ways to improve your science writing
Effective science communication involves putting complex information into simpler terms that can be accessible for a broad range of target groups. Here are five tips to help improve your science writing and communication.
Explore more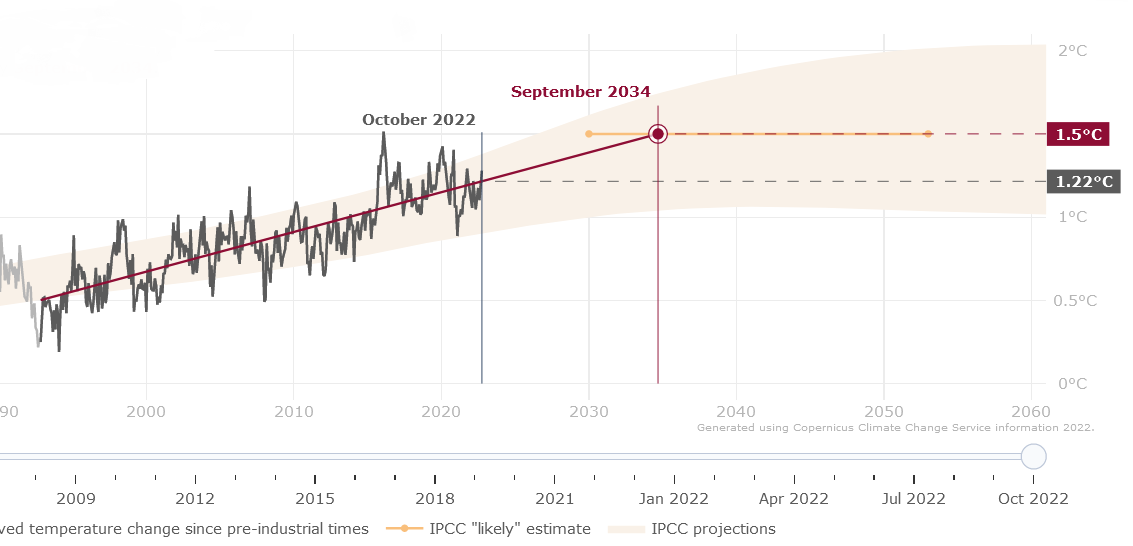
VisualisingGlobal Warming Trendsover time
Collaborating with ECMWF & B-Open, Design & Data developed an interactive application to visualise the current global warming trend in relation to reaching the globally adopted 1.5°C limit.
Explore more

5 effective waysto enhance yourVoiceover Recordings
Voiceovers can be powerful tool, but many viewers are likely to stop watching a video with poor audio quality. Here are 5 tips to creating more professional voiceover recordings.
Explore more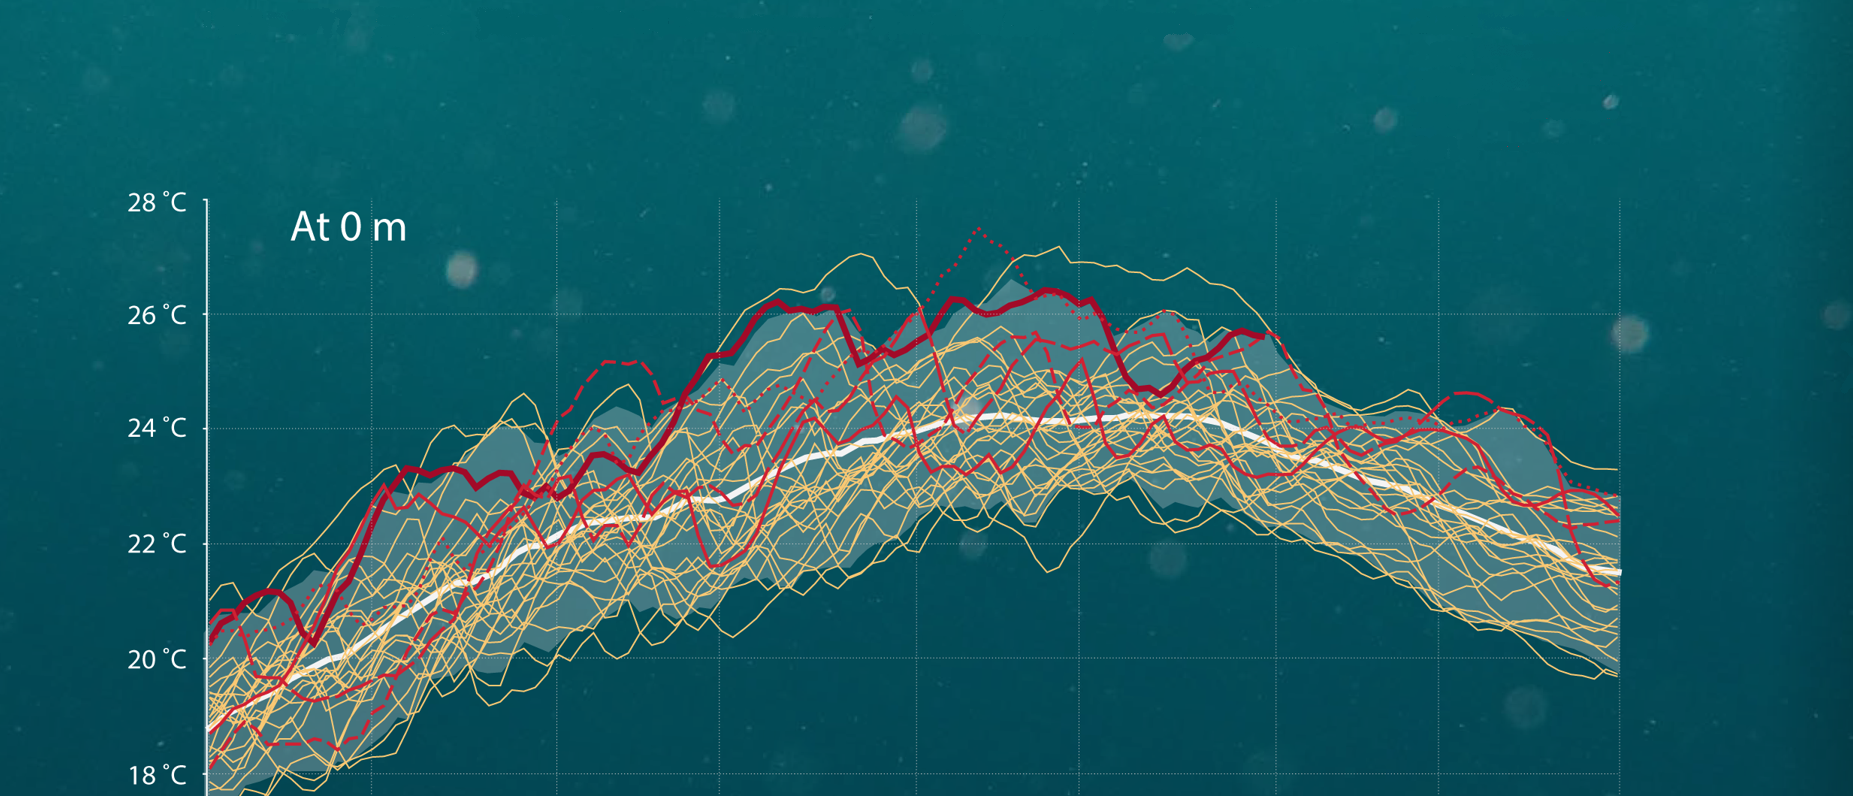
Graphic Design forData Visualisation
Using creative graphic design and programming, D&D created a new version of an infographic highlighting the rise in recent marine heatwaves in the Mediterranean Sea.
Explore more