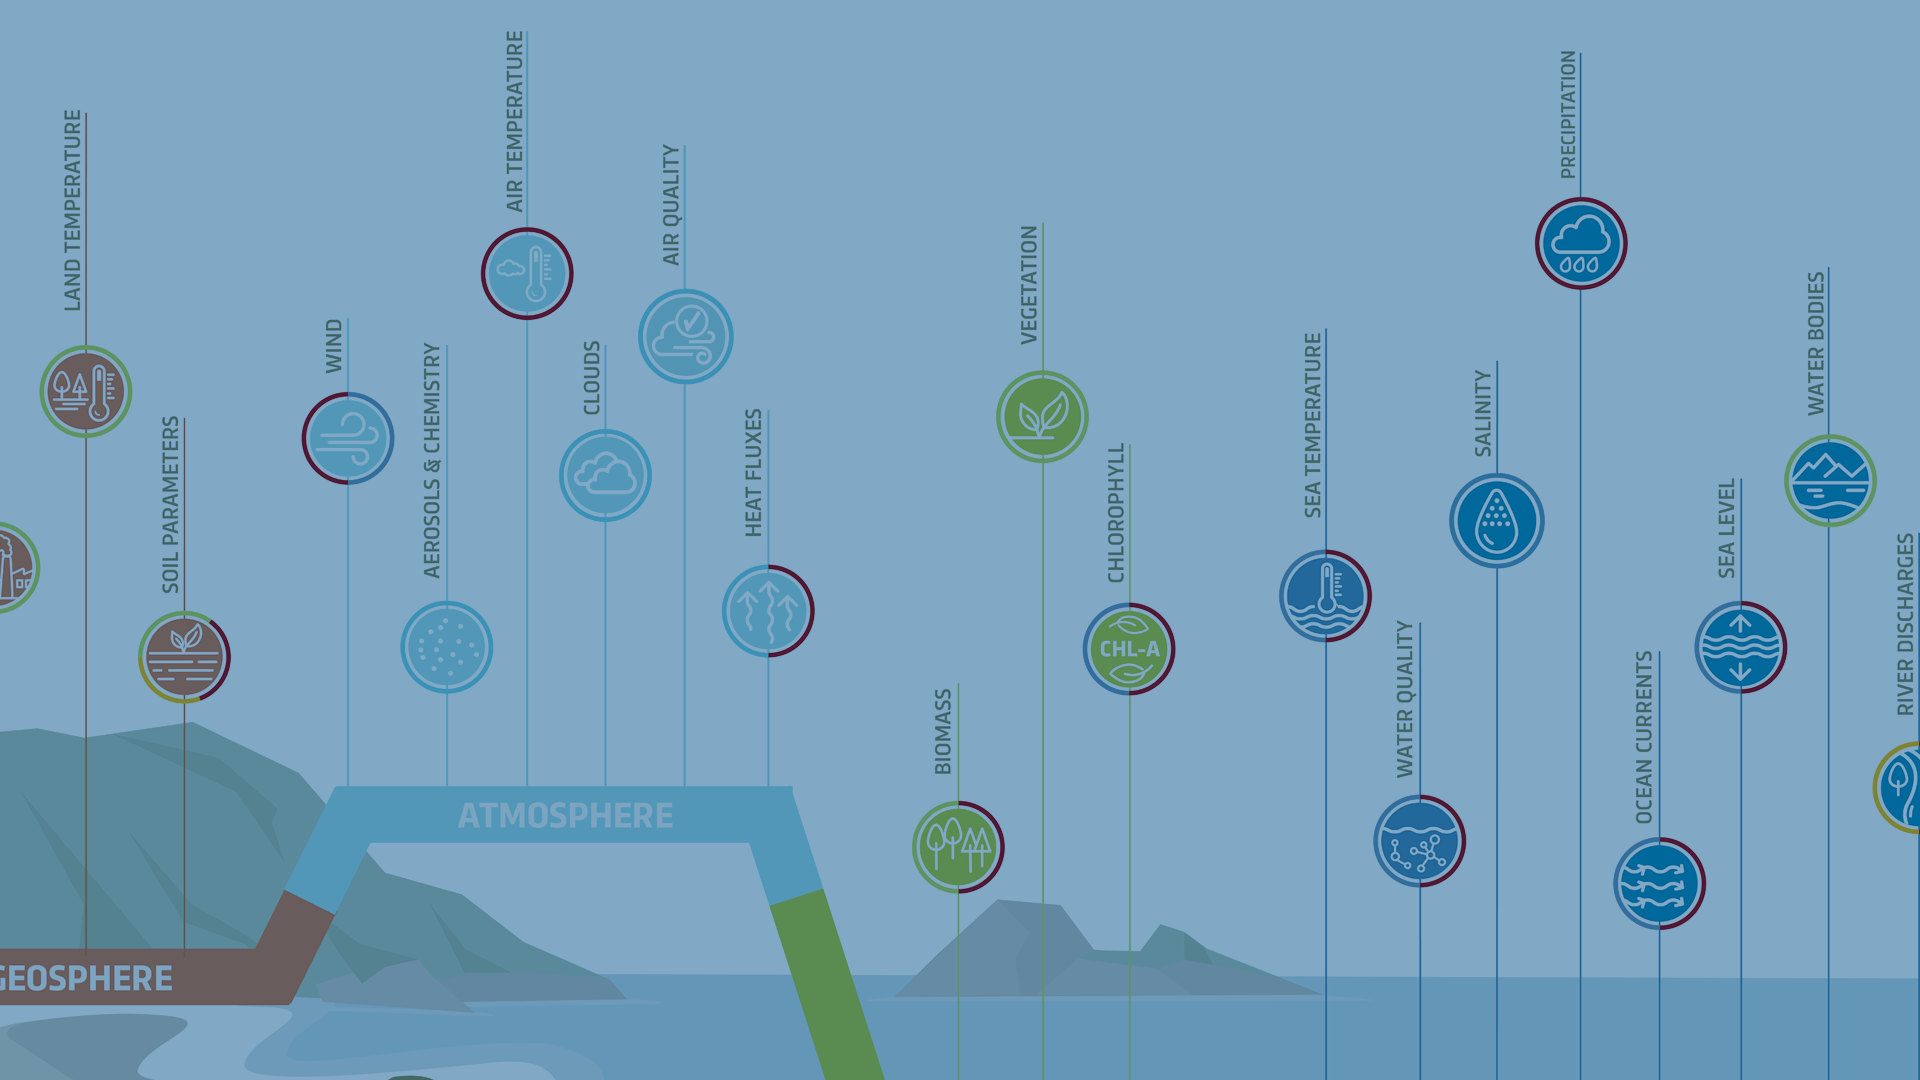
Crafting 'In a Nutshell'Infographics forEarth Observation Data
In the realm of infographics, the concept of 'data in a nutshell' implies presenting information that is clear, concise, and offers valuable insights without inundating the audience with unnecessary details. Explore our approach here.
Explore more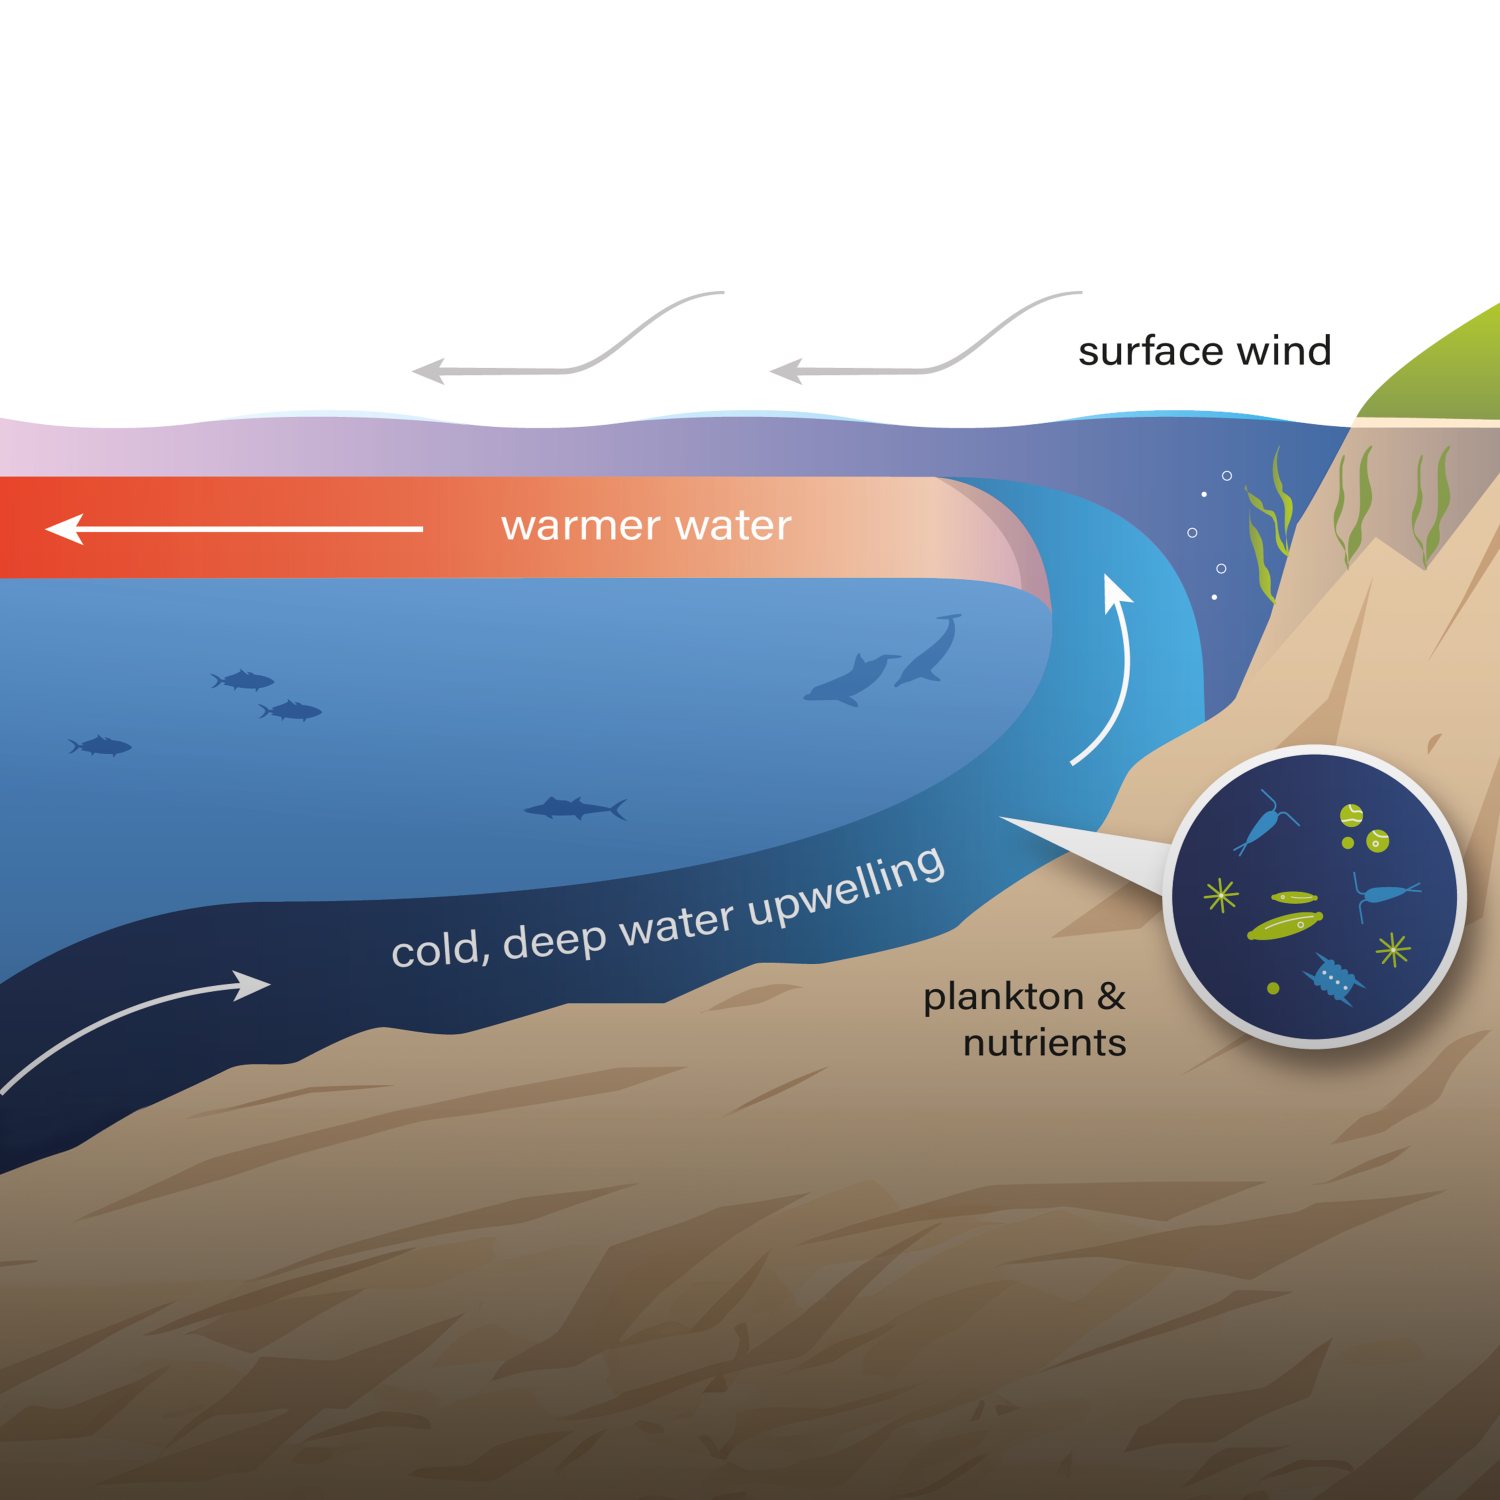
A new episode inMercator'sAnimation Series:Digital TwinOcean 2
Explore more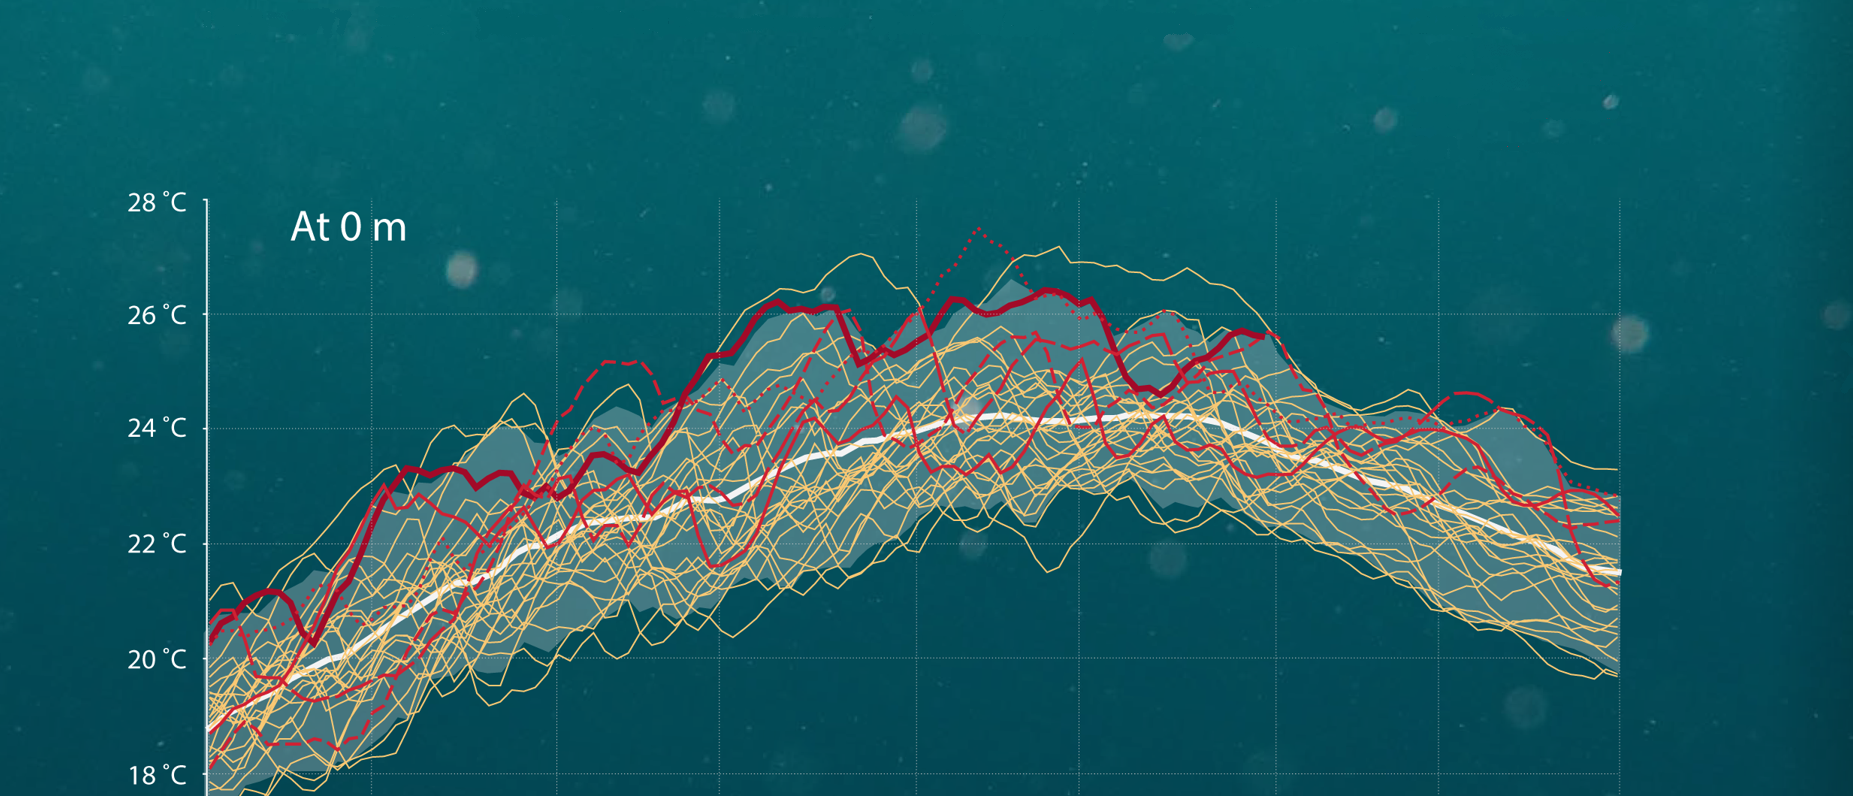
Graphic Design forData Visualisation
Using creative graphic design and programming, D&D created a new version of an infographic highlighting the rise in recent marine heatwaves in the Mediterranean Sea.
Explore more
Text Campaign for promoting the 6th Ocean State Report
D&D produced a high-level text campaign to summarize and promote the 6th Copernicus Ocean State Report for a wide and varied audience.
Explore moreAnimating thedigital twinocean
Explore more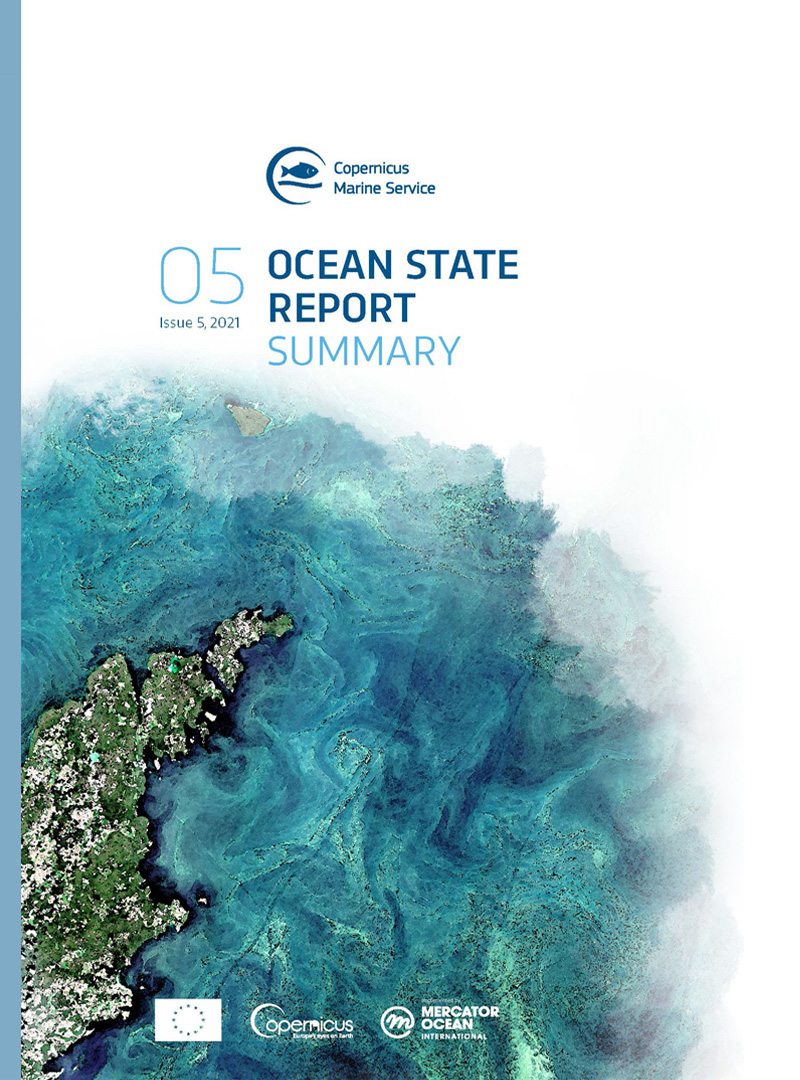
Creation of theOcean State ReportSummary, Issue 5
Design & Data produced a 20-page summary for the 5th annual Ocean State Report alongside Mercator Ocean International, providing a comprehensive report on the state, variations, and changes in the global ocean.
Explore more