VisualisingGlobal Warming Trendsover time
Collaborating with ECMWF & B-Open, Design & Data developed an interactive application to visualise the current global warming trend in relation to reaching the globally adopted 1.5°C limit.
Explore more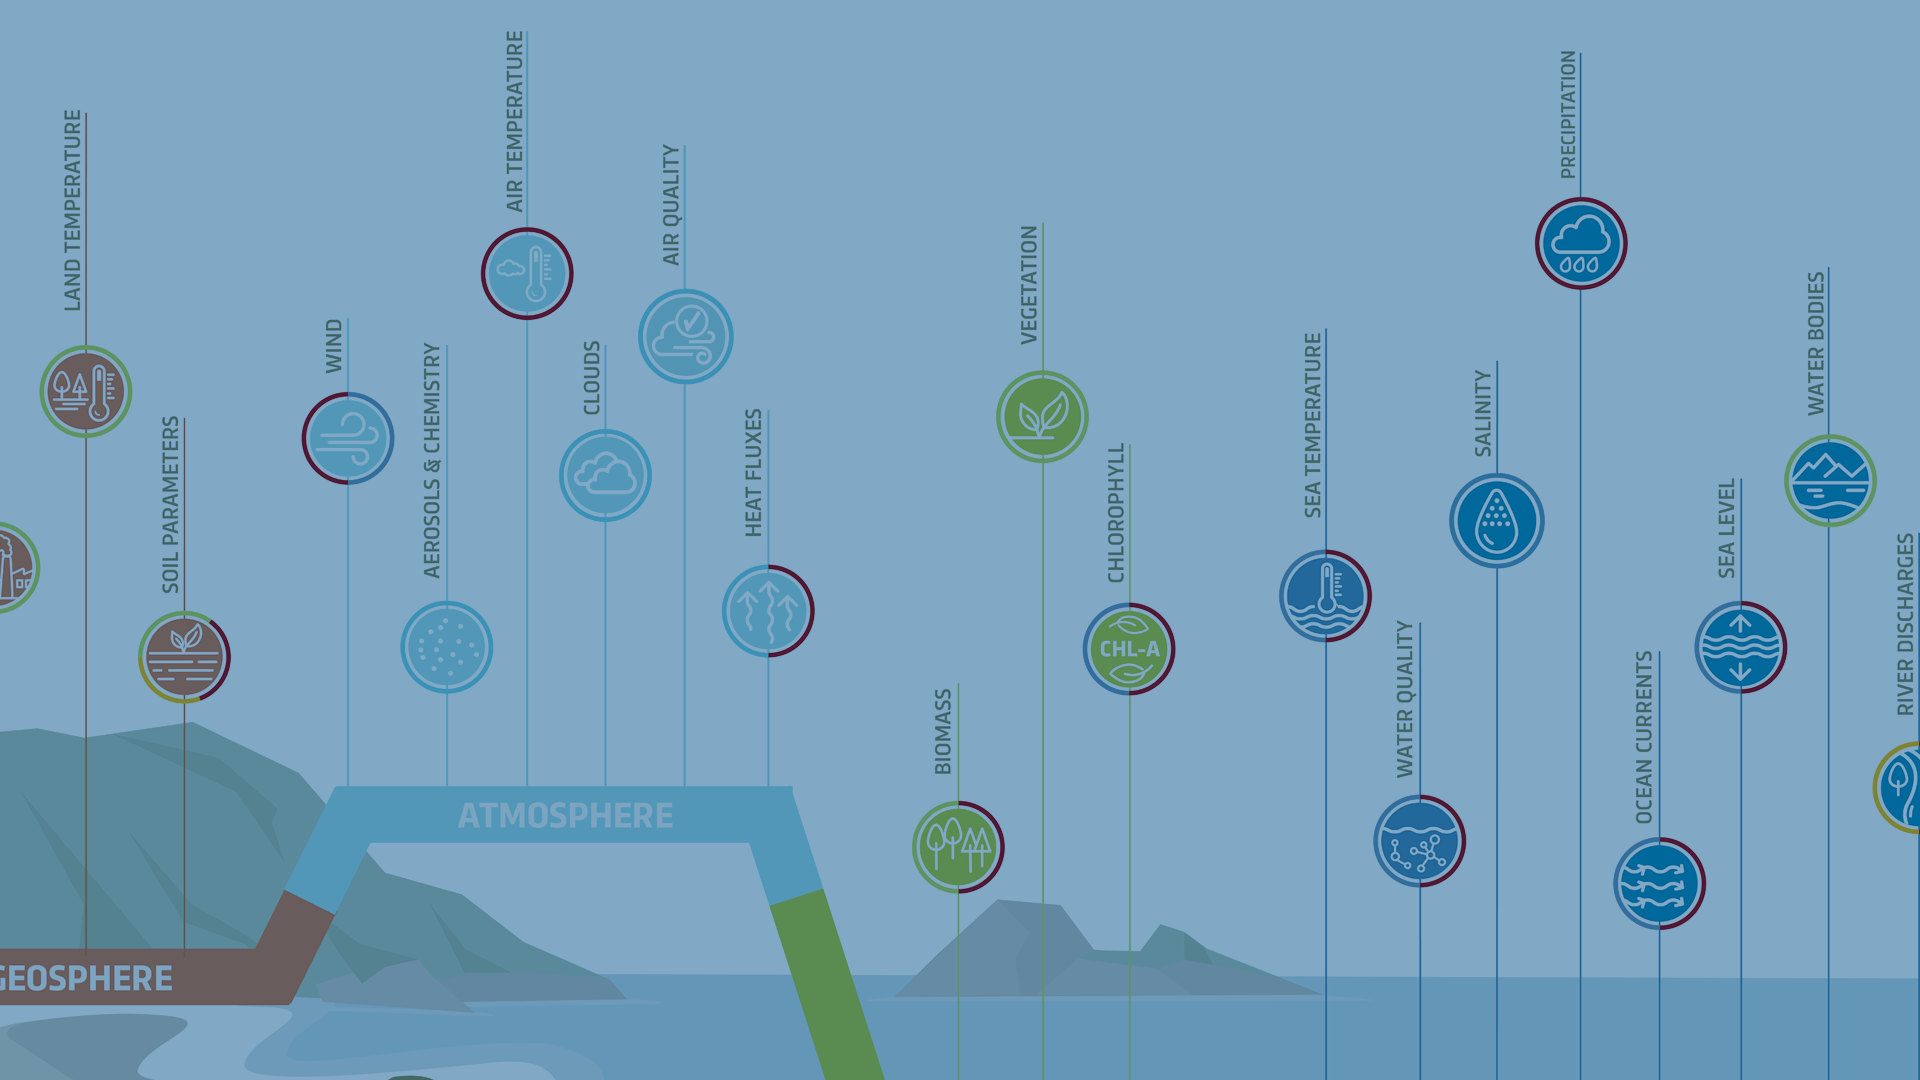
In the realm of infographics, the concept of 'data in a nutshell' implies presenting information that is clear, concise, and offers valuable insights without inundating the audience with unnecessary details. Explore our approach here.
Explore more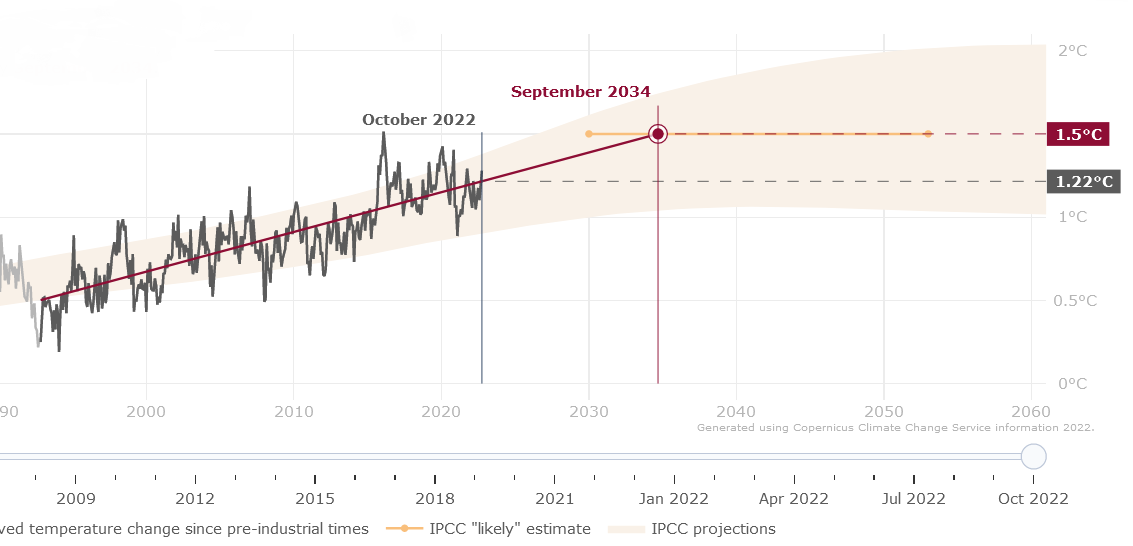
Collaborating with ECMWF & B-Open, Design & Data developed an interactive application to visualise the current global warming trend in relation to reaching the globally adopted 1.5°C limit.
Explore more
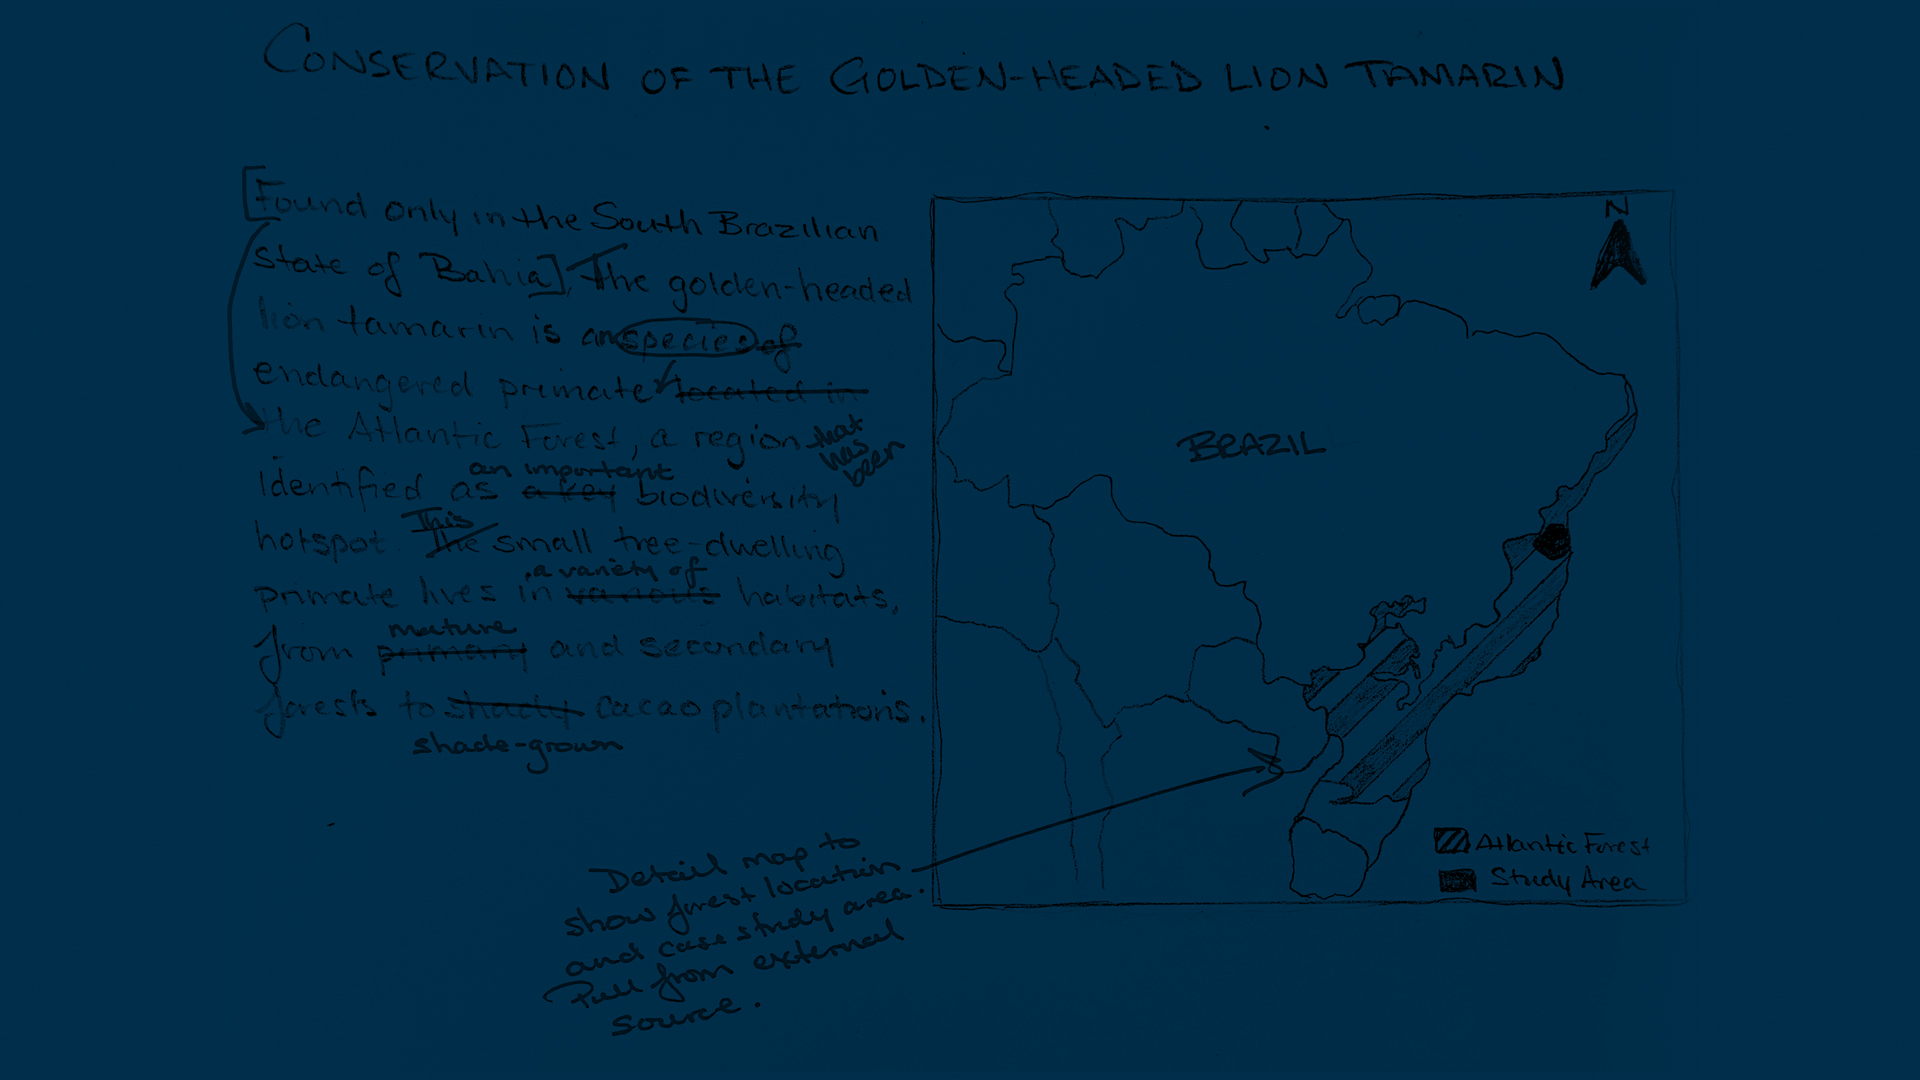
Using Shorthand – a web based tool for creating digital stories – Design & Data worked alongside ECMWF and EJR-Quartz to promote Copernicus CAMS and C3S data and products through the creation of individual climate-related case studies.
Explore more